A Rutgers expert explains why polls matter, their benefits and limitations, and how pollsters are adapting to the political challenges of today
As the Nov. 5 general election draws near, polls are poised to take center stage once again, sparking critical conversations about their role in shaping public opinion and electoral outcomes.
After recent election cycles where polling accuracy has been both celebrated and questioned, what should we expect this time around?
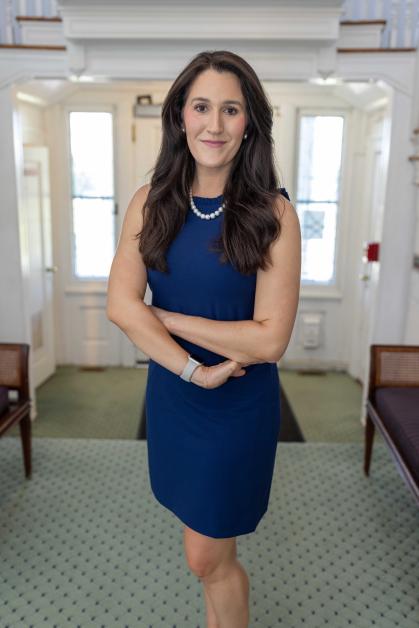
“Polls are still the most systematic way we have of estimating public opinion,” said Ashley Koning, director of the Eagleton Center for Public Interest Polling at Rutgers University-New Brunswick. “But while polls offer valuable insights, they’re not crystal balls.”
Koning discusses the role of polling, the challenges facing pollsters and how voters should interpret this year's data.

What makes polling essential today? What insights do they offer that we can’t find elsewhere?
Polling is really the only quantifiable, systematic method we have of estimating what the public thinks in a way in which all voices are represented. Unlike other participatory acts in the political process, it requires only a few minutes of time and, when done correctly, is the most representative snapshot of public sentiment we have besides voting – especially for issues that never get their day at the ballot box.
How accurate are polls, really? What factors can skew their accuracy?
While we can talk about how factors – like who conducted the poll and the political environment – contribute to a poll’s accuracy (and they do), poll results are survey estimates that are bounded by inherent statistical uncertainty.
Polls can tell us if a race is close or not, how people feel and what they think, how they behave, and why they vote the way they do. But polls are not meant to tell us the winner. Because polls produce numbers as results – and are indeed the most quantitative and representative interpretation of the people in the political process that we have – we misperceive them as some sort of oracle and their numbers as etched in stone.
What lessons have pollsters learned from previous election cycles, and how are they adapting their methods this time around?
Pollsters have been continuously hard at work since 2016 on the challenges that have plagued polling. Some issues are fixable – such as the inclusion of education in weighting data now to capture the low-educated white vote that was sorely missed by pollsters in 2016. Some pollsters are now weighting on vote recall in previous elections and/or partisan identity.
But the biggest challenge yet to the polling industry is not something with a quick or easy solution – the growing distrust in polls among Trump voters, their unwillingness to speak with pollsters and Trump turning out the kinds of voters who typically do not answer polls in the first place.
What makes a poll nationally representative, and how do we know that a sample of 1,000 people accurately reflects the views of millions?
We can’t poll everyone, and we don’t. It would be impossible and take an exorbitant amount of time and money. That’s where statistics come in. We take what’s called a “random sample” of the population we want to study. This type of probability-based sampling ideally gives each member of a population an equal and known chance of being a part of the study; even if you don’t get contacted, someone with similar views to you will. Think of it like taking a spoonful of soup from an entire pot to see how it tastes or a doctor drawing a blood sample.
Once we talk to several hundred people, our statistical confidence in our survey estimates becomes exponentially stronger because the margin of error – how closely our survey estimate is to the true population value – becomes smaller. Past a certain point, typically over 1,000 respondents, it does not benefit pollsters to spend more time and money on conducting more survey interviews because that statistical confidence starts to plateau and can’t get much smaller.
Do people lie to pollsters?
Of course, people lie or exaggerate the truth, but with the way in which high-quality polls are conducted, these instances are not frequent enough to negatively impact the data and basically are just random noise that balance out once we look at the data as a whole. The greater concern for pollsters these days is nonresponse bias – especially the nonignorable kind that has exponentially grown in the past few election cycles as polls and science become less trusted by certain segments of the population.
What is the margin of error?
Survey estimates are unlikely to perfectly match the actual results in the population–close, but not perfect. The margin of error is the price we pay for sampling. It describes how close we expect a survey estimate to be to the actual value if we had surveyed everyone. Think of it as creating a lower and upper boundary of statistical confidence around a survey estimate. For example, if 50% of adults in a sample favor a particular position, and the margin of error is +/- 3.0 percentage points, we would be 95% sure the true figure lies between 47 and 53 percent (50 +/- 3.0) if all adults had been surveyed. The margin of error is influenced by factors such as sample size, survey mode, response rate, variability, weighting and design effect. In fact, survey researchers are increasingly looking at the margin of error with a more critical lens, some even suggesting doubling it to account for additional measurement errors beyond sampling, such as nonresponse and question wording.
With so much conflicting data available, how can people tell the difference between a good poll from a bad one?
There are several great sites out there now (like The New York Times and ABC News) that actively talk about polling data and can help those in the general public sift through the good, the bad, and the ugly when it comes to polling. These data journalism sites rate polling organizations and analyze some of the latest polls that have been released, as well as conduct their own according to best methodological practices. The more information a poll provides – who conducted it, how it was conducted, how many respondents, what the margin of error is, what they weighted on, etc. – the better it likely is in terms of quality. Be a good data consumer by being a bit of a detective.


